Pokemon Team Strategizer

I recently started this as a fun side project outside of work to learn about Tailwind, Elastic Search, and High Charts! I'm in the works of architecting a fun website where users can craft Pokemon teams and view statistics in beautiful visuals. Currently, I'm in the design phase of this project but more updates to be continued!
Who's that Pokemon Trainer? It's ______!
This was a Machine Learning semester project for my Usable Artificial Intelligence class that used Kaggle's Pokemon csv which contained various information on Pokemon. The goal of this project was to determine a non-playable character (NPC) trainer's class from the various found in the Pokemon games. I worked with two other people and we worked collaboratively on manually collecting nearly 4000 trainer classes and their pokemon teams. My role on the team was coding the project where I performed data cleaning and analysis using primarily Python and Pandas. In the end, our model had a 46% accuracy, but this was expected as we did not have many samples for some classes, or too many for others. For more details, click here!
You can also check out our written report that discusses how I cleaned data and showcases visualized information.
Pokemon NPC Trainer Classifier
Project Description
In the world of Pokemon games, there are various NPC trainers you can encounter. For our project, we built a classifier that attempted to determine a trainer class for a given pokemon team. In order to do this, I looked at various statistics of pokemon, such as their weight, height, attack, and other stats all found from the Kaggle file. We also needed a main file that contained the trainer class and their pokemon teams. This file was created manually by the whole team and because there were so many instances, we limited our game generations to look at to generations 1 through 4. I first preprocessed the data with simple text cleaning and removed classes that had not nearly enough instances to use in our model. I then had to determine how to represent the qualitative data as quantitative. Determining a model was difficult because of the varying team sizes, but the steps we took are elaborated further in the next section.
Methodology
Because we were working with textual data, I first needed to make sure all the text was cleaned and had the same formatting. In this case, everything was lowercased and possible spaces were removed. Spelling errors were common in our manually-created file so I created a function that would help me determine which rows had a spelling error. We then removed classes that had less than 10 instances, which brought us from nearly 100 different classes to 52. We chose 10 as it was the median for the number of instances of each trainer class.
The next part was to vectorize the data. By vectorizing the data, we could convert our categorical data into numerical data. While it is pretty common for trainer classes to have specific themes, such as the Sailor class having only Water type pokemon, we also needed some other metric for classes that had varying distributions so that's why we used the Pokemon stats as well. I created a vectorizer function that would take an element type of a Pokemon and create a one-hot encoded elemental vector essentially. For the statistics, I created a vector that would contain the standard deviation of the pokemon statistics rather than the means because the standard deviation would represent the overall spread of the team. The statistics were normalized before this using mostly Power Transformer, but also Robust Scaler.
The Model
I wanted to implement a Recurrent Neural Network(RNN) for our project because it handles the varying lengths of pokemon teams well. The issue with the varying team lengths (the number of pokemon per team can range from 1 to 6) is that if we consider teams of just 1 pokemon and add padding to match the length of teams of 6, we lose valuable information. Using a neural network would help solve that problem. But unfortunately, my computer could not handle the model, so instead we did a LSTM machine learning model that would take a padded elemental vector and the statistics vector.
First, the training and testing data were split into respective sets and were stratified according to the target variable (i.e., the trainer class) to ensure equal class distribution in both sets. Next, the input variables (team vectors and team statistics) and target variable (trainer class) were extracted from the training and testing data, respectively, and preprocessed for use in the model. The team vectors were padded using the `pad_sequences` function from TensorFlow. The reason why we did want to use MLP-RNN was to avoid having to pad the Team Vectors, but it was just unavoidable for us. The team statistics were flattened. The target variable was one-hot encoded using the `to_categorical` function from TensorFlow so we could convert it from strings to ints for the model. The model architecture is defined using Keras functional API. The model has two inputs, one for the team vectors and another for the team statistics, and one output for the trainer class. The team vectors input is passed through an LSTM layer with 64 units. The resulting output is concatenated with the team statistics input. The concatenated output is then passed through three dense layers with ReLU activation functions and decreasing numbers of units (128, 64, and 32). The output was passed through a dense layer with 52 units and a softmax activation function to obtain the class probabilities. The model was compiled with Adam optimizer, categorical cross-entropy loss function, and accuracy metric. The model is trained on the training data using the `fit` method, with a batch size of 32, 10 epochs, and validation data consisting of the testing data. The training and validation metrics (loss and accuracy) were printed for each epoch too, which are featured in the Visualization section of the report (exit out of this pop-up to click on the report listed in the section if you're interested in more details!).
Conclusions
The accuracy of the model was quite poor: 46.54%. However, there were various factors that could have contributed to such a low accuracy. We knew that padding the data would be an issue as there were many teams that had less than 6 pokemon in their team. Additionally, there may not have been enough data for some samples. Something else we could have tried to do is only keep classes with 20 instances or higher. We also had classes that had much more samples than any other class. While we did attempt to stratify the trainer class target variable, it is possible that overfitting was indeed an issue.
However, I'm still incredibly proud as this was a project I had not seen anywhere online. I first got into Computer Science because of how much I loved the Pokemon games and I was glad that my last school project combined my love for machine learning and Pokemon.
Optical Music Recognition
This was an assignment for my Introduction to Computer Vision class. I worked collaboratively with two other students to see this assignment fulfilled. We utilized Python to implement Computer Vision techniques to accurately label music notes in a music sheet. To view a breakdown of our approach, click here!
Optical Music Recognition
Project Description
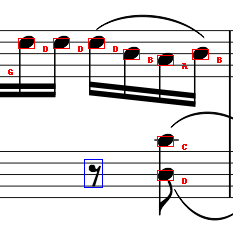
Given a music sheet, identify the pitch of a note using line detection and note recognition and produce a labeled music sheet.
Design Decisions and Assumptions
No note can be labeled as sharp or flat. All notes are assumed to be labeled as natural. All the staves will have a slope of 0 and be perfectly straight lines. Therefore when assigning names to notes, we use the y-axis to serve as a measure of distance as the determinant. The templates will be the same exact size as the notes it encounters in the music sheet. Therefore we did not resize the template or the music sheet.
Coding Classes and Functions
Convolution
We created a convolution function called general_conv. This function takes in three parameters: the image, the filter that it should be convolved with, and whether or not that filter is a template. The function, after determining whether we are doing convolution or cross-correlation flips the filter horizontally and vertically to make the filter a convolutional kernel. Then, two for loops are used to traverse through the image space and calculate the dot product of the kernel and image. The results are then sent to a function. The results are then stored in an image variable that is returned. Initially, we did not include the third parameter but we implemented it for our template matching algorithm.
Separable Convolution
For this, we created a function called sep_conv. It takes in three parameters: the image, an H_x filter, and an H_y filter. We make a call to general_conv and send in the image with one filter at a time and store the results in a variable that is returned.
Template Matching
We created a function detect_template which takes in two parameters: the image and the template. The template will contain the type of note that can be encountered in image (which is a music sheet). A cross-correlation is performed on the image with the template and the results being stored in score_image. Then we have a for loop that traverses over the image space and checks if, at a position in the image space, if there is a match with the template and image. We experimented with threshold values and used 0.7 as it helped detect more true positives. There was an issue of values exceeding the 255 limit, so normalization had to be implmeneted.
Edge Map Scoring
For this problem, we created a function sobel_edge_detector which takes in an image and two filters. We performed the separable convolution on the image with the two filters and then computed the gradient magnitude and normalized it after to ensure that the gradient magnitude did not exceed 255. The function to calculate the edge match scores, we created a function called score_func that was inside of another function called sobel_matching. This algorithm utilizes the sobel_edge_detection function made earlier and calculates a score for the similarities. In our current implementation, it would take quite some time to compute the scoring matrix, but utilizing dynamic programming would definitely speed up the process.
Hough Space
The function we used for it is hough_space. With this function, we are able to determine the staff heights which helps with pitch detection. It also determines the locations of the staves. This function required a lot of tuning on the extrema detector. Generally, the more staves/more complexity the music has, the higher the neighborhood. It would probably make sense to establish the neighborhood as a function of the size of the image, but we did not do that.
Pitch Detection
The function we created for this is called get_pitch. To determine what note is on the staff, we determine what clef the notes on the staves are in. Then, based on the distance the note is away from the nearest staff, the note can be labeled by using the index of where the note is relative to the staves.
Conclusions
The algorithm can identify the clefs correctly and can correctly name the notes for each respective cleff. It can also place the box around the notes. For improvements, we could have implemented a resizing method that would ensure that the template would be the appropriate size to convolve with. Our Edge Mapping function was quite slow, but if we used a dynamic programming approach, its time complexity would have significantly decreased.
Snake Game
This was a final project for my Introduction to Artificial Intelligence class. I worked collaboratively with a group of four. We used Python and various libraries to create a Snake that would learn to play the game using BFS as a comparison to the Qlearning reinforcement algorithm. For more details, click here!
For details about the algorithm and design, empirical analysis, or external resources, please refer to this report.
Snake Game
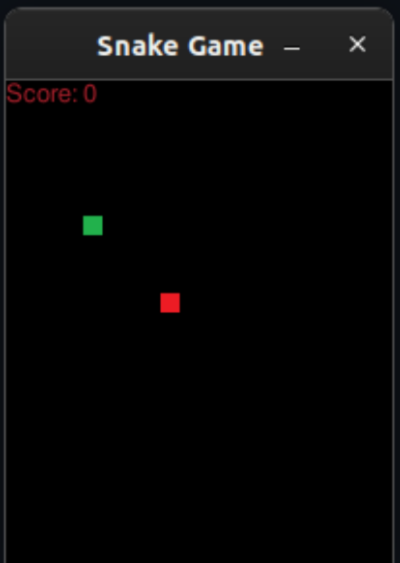
Project Description
For our project, we decided to create the Snake game that will teach itself to pass through as many game levels as possible with reinforcement learning. The rules of the Snake game are to get the head of the “snake” to overlap the targeted square. The “snake” begins as a single square and gets one square longer for each targeted unit (the 'food') it overlaps, and the game ends when the snake hits a wall or into any part of itself. Once the targeted square is 'eaten', a new food unit will be randomly placed on the board while the snake stays in the same position, and the game will continue this process until it meets the ending game requirements. The main challenge is making sure the snake does not run into itself or the wall since more space will be occupied by the snake as it eats more food units which will leave less room for it to maneuver around the game board. The way that the AI chooses to move directly influences the future state of the game; for example, the board (represented by pixels/blocks), becomes occupied by the body of the snake over time. The path that the snake will have to take will be different depending on its size and the snake will have to recognize itself continuously. Additionally, since the food is generally randomly generated across the board, paths will have to be different depending on the randomization of the reward as well. Pixels do not support diagonal paths and rely on finding linear routes through corner turns so finding the corners to turn that minimize the risk of impact is important. We recreated the single player version of the game where the machine learns to play by utilizing Python and some of its libraries such as PyGame, numpy, random, pickle, queue and used a board of 200 x 250 pixels.
Solution as a Human Model
Our solution imitates the way a human would think through negative and posi- tive reinforcement. The AI is rewarded with points based on their actions. If the system hits the target it gains 10 points while it will lose 1 point for landing on empty space and lose 5 points for ending the game. The goal is for the game to get as many points as possible or the smallest negative number possible. Similar to a person, the AI tries to win by receiving a reward for what others deem as good actions, which in a human would initiate a positive response. Both the AI and a person are motivated by the reward so they would attempt to repeat the actions that earned them the points. Losing points would cause a similar reaction as well. Both the AI and a human will try to prevent losing points since they are punished for wrong actions. In doing so, both the computer and person would want to avoid the actions that would reduce their points or subtract from what they previously earned.
Conclusions & Improvements
All in all, the AI does adapt to its environment fairly quickly and does eventually learn how to get the food. However, trying to surpass 5 or 6 points would get more and more difficult almost exponentially as time goes on- the reason being that the snake's body would continue to grow and the way the algorithm adapts would be slow to avoid self collision, especially when near completion. In order to help alleviate the burden a higher level would cause, giving reward to having a larger amount of non-enclosed space would be a good way to ensure better future results. Non-enclosed space refers to the space that the snake does not cover with its body- by minimizing the space (by going in looping or closely knit patterns), the AI will be more efficient in solving the problems and eliminate some common defeats in the late stage game. All in all, we learned that while writing the initial game and learning algorithm was not difficult, getting the algorithm to give the snake the optimal chance of winning was difficult to fine- tune, and required forethought to the design of the game and the way that the AI would eventually learn to handle the board.